
How to Measure Explainer Video ROI: The Complete Framework (2026)
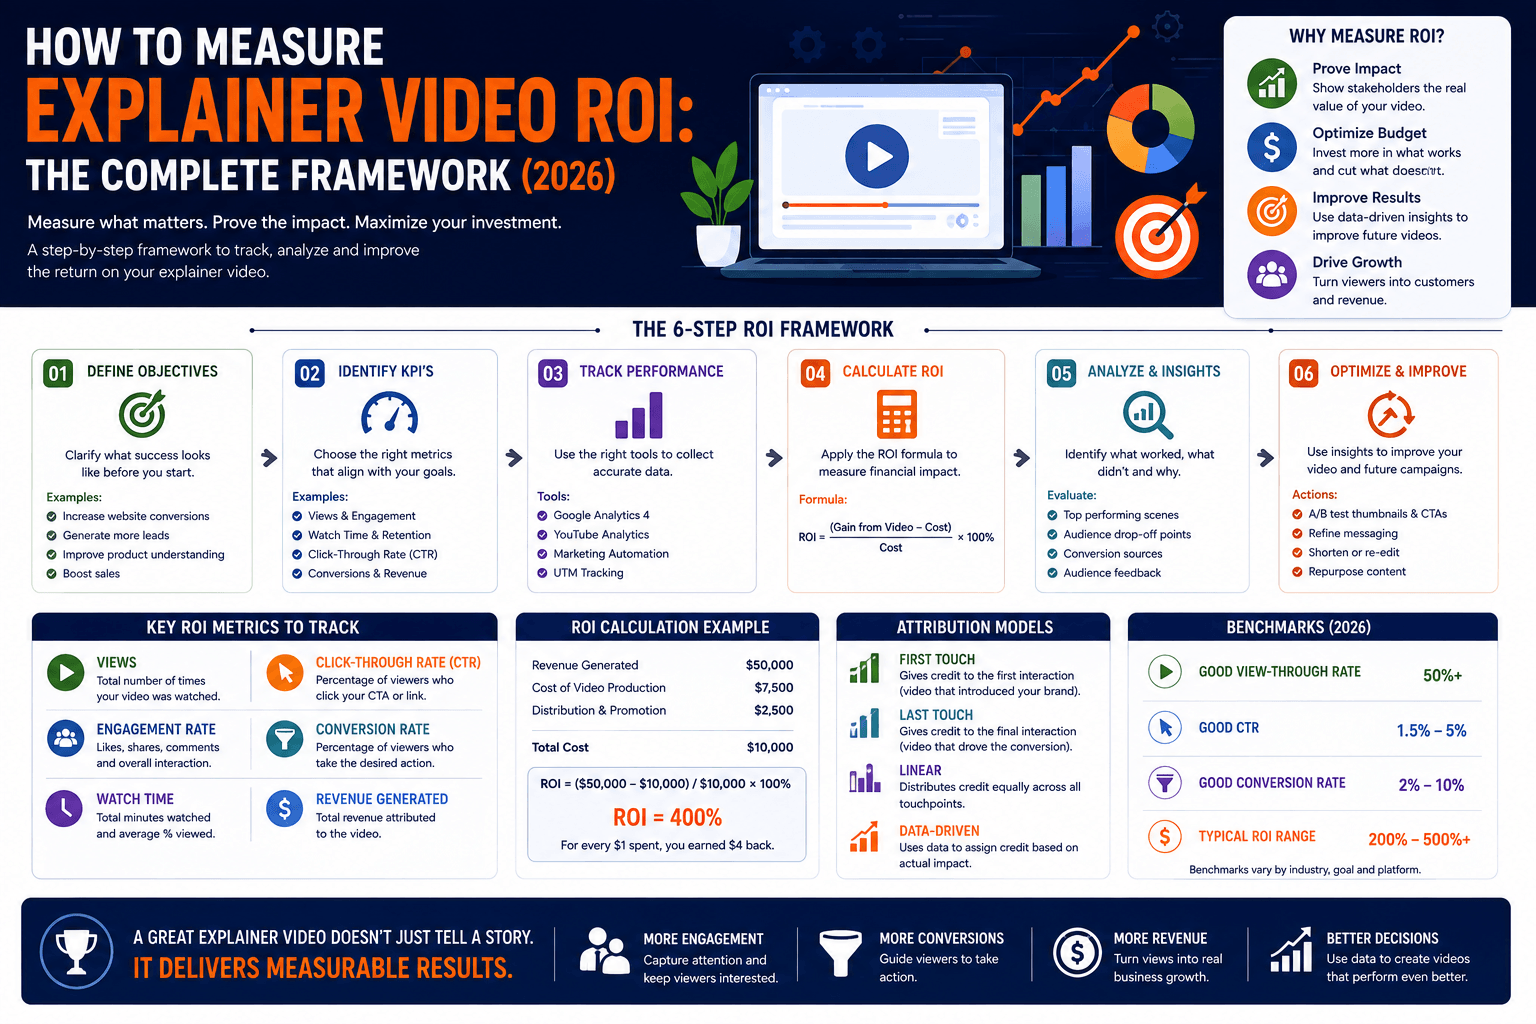
To measure explainer video ROI, apply this formula: ROI = ((Revenue Attributed to Video − Total Video Cost) / Total Video Cost) × 100. Track four metric categories: engagement (watch time, completion rate), conversion (CTA clicks, form fills), revenue (cost per lead, attributed sales), and support deflection (ticket reduction). Use a 90-day minimum window and attribute revenue through UTM parameters or CRM lead source tagging. This guide covers the full framework, platform-specific tracking, industry benchmarks, and what to do when results underperform.
Most marketing teams that commission an explainer video do one thing after launch: watch the view count. That number climbs for a few weeks, then levels off, and the video quietly collects dust while the budget question for the next video goes unanswered.
The problem is not the video. The problem is the measurement framework. Learning how to measure explainer video ROI is the difference between a video that justifies its production cost in 60 days and one that gets written off as a vague "brand play" with no clear outcome. Every explainer video leaves a measurable trail across four distinct performance layers: engagement, conversion, revenue, and operational savings. Most teams track only the first one.
This guide covers the complete framework: the formulas, the platform-specific tracking methods, the industry benchmarks you can compare your results against, and the diagnostic process for when a video underperforms. Whether you are evaluating a video before commissioning it or extracting more value from one that is already live, this is the reference you need.
Sources: Wyzowl Video Marketing Statistics 2026; Unbounce landing page data.
What "ROI" Actually Means for an Explainer Video
Before diving into the measurement framework, it is worth clarifying what ROI means in this specific context, because the definition for video is broader than most teams realise.
Return on investment in traditional marketing means: net gain divided by cost, expressed as a percentage. But for an explainer video, the "gain" side of that equation operates across five distinct value streams at once:
- Direct conversion value: leads and sales you can trace back to the video through UTM tracking or CRM data
- Brand lift value: improved trust, recall, and perception among prospects who watched but did not convert immediately
- SEO value: organic traffic driven by video-related queries and improved dwell time on pages where the video is embedded
- Support deflection value: fewer customer service contacts because the video answers common questions before they become tickets
- Onboarding value: faster product adoption when the video is embedded in the customer education flow
Most businesses can practically focus on two of these: direct conversion value and support deflection value. Both are fast to generate, straightforward to quantify, and directly comparable to production cost. Brand lift and SEO value are real, but they operate over longer timescales and require more sophisticated attribution setups to isolate.
A conversion that happened while a video was on the page is not automatically caused by the video. Proper attribution, covered in the platform section below, is how you establish a genuine causal link between the video and the revenue rather than a coincidental correlation.
The Explainer Video ROI Formula
The foundation of any approach to measuring explainer video ROI is a clear formula. There are two versions: a basic one for direct-sales businesses and an advanced one for lead-generation funnels. Use whichever matches your business model.
The Basic ROI Formula
Total video cost (production + promotion): $8,000
New customers attributed in 90 days: 10
Average customer value: $1,500
Revenue: 10 × $1,500 = $15,000
ROI = (($15,000 − $8,000) / $8,000) × 100 = 87.5%
That 87.5% is a solid 90-day result. But if that average customer stays for three years and their lifetime value reaches $4,500, the long-term ROI from the same video climbs to 462%. This is why measuring explainer video ROI over a single campaign window consistently undervalues the asset. A video does not stop generating returns the moment the measurement period closes.
The Advanced Formula for Lead-Generation Funnels
If your business model generates leads before converting them to customers, the basic formula misses the full picture. Use this expanded version instead:
Leads generated by video in 90 days: 80
Lead-to-customer conversion rate: 15%
Average sale value: $2,500
Total cost (production + promotion): $10,000
Revenue: 80 × 0.15 × $2,500 = $30,000
ROI = (($30,000 − $10,000) / $10,000) × 100 = 200%
A 200% first-year ROI is consistent with what Shootsta reports as typical for well-executed B2B video programs: 250 to 500% in year one.
What to include in Total Video Cost: production studio fees, animation and voiceover, music licensing, revision rounds, paid promotion spend, internal team time (project management and review cycles), and ongoing hosting or analytics tool costs. Under-counting the investment side inflates your ROI figure and leads to poor decisions about future video budgets.
Ready to Commission a Video That Delivers Measurable ROI?
Magic Motion Studio produces explainer videos for brands across Australia and the US. Get a quote in 24 hours.
The 4 Metric Categories You Must Track
Knowing the formula gives you the output. But the inputs come from four distinct metric categories. High-performing teams track all four simultaneously rather than relying on a single dashboard number to tell the whole story.
Engagement Metrics
How well the video performs as content, independent of downstream conversion. Low engagement signals a problem with the video itself before you can blame the funnel.
- Play rate: percentage of page visitors who press play
- Average watch time: how long viewers stay before dropping off
- Completion rate: percentage who watch to the end
- Drop-off point: the specific second where most viewers leave
Benchmark: For a 60 to 90-second explainer on a product landing page, a healthy completion rate is 55 to 70%. Below 40% signals a weak opening hook.
Conversion Metrics
The bridge between engagement and action. These numbers connect video performance directly to business intent signals.
- CTA click-through rate: clicks on the button inside or below the video
- Form fill rate: visitors who complete a contact or lead form after watching
- Landing page conversion rate: overall conversion rate on pages with the video embedded
- A/B test lift: conversion improvement vs the same page without video
Benchmark: Landing pages with video see conversion rate lifts of up to 80% vs text-only equivalents, per Unbounce data.
Revenue Metrics
The numbers that actually feed the ROI formula. Without UTM tracking and a CRM, these figures are guesses rather than data.
- Leads generated: total leads attributable to the video over the measurement window
- Cost per lead (CPL): total video cost divided by leads generated
- Customer acquisition cost (CAC): video cost divided by customers acquired
- Attributed revenue: direct revenue linked to the video through UTM or CRM tagging
- CLV uplift: whether video-acquired customers retain longer or spend more
Support and Efficiency Metrics
The most commonly overlooked value stream, yet often where the fastest return lives. A product video that handles common questions before they become support tickets is generating real ROI that never appears in a conversion dashboard.
- Support ticket reduction: compare ticket volume before and after the video goes live
- Onboarding call reduction: if the video replaces a manual walkthrough session
- Early-stage churn reduction: customers who understand the product better stay longer
- Training cost savings: for videos used in internal staff onboarding
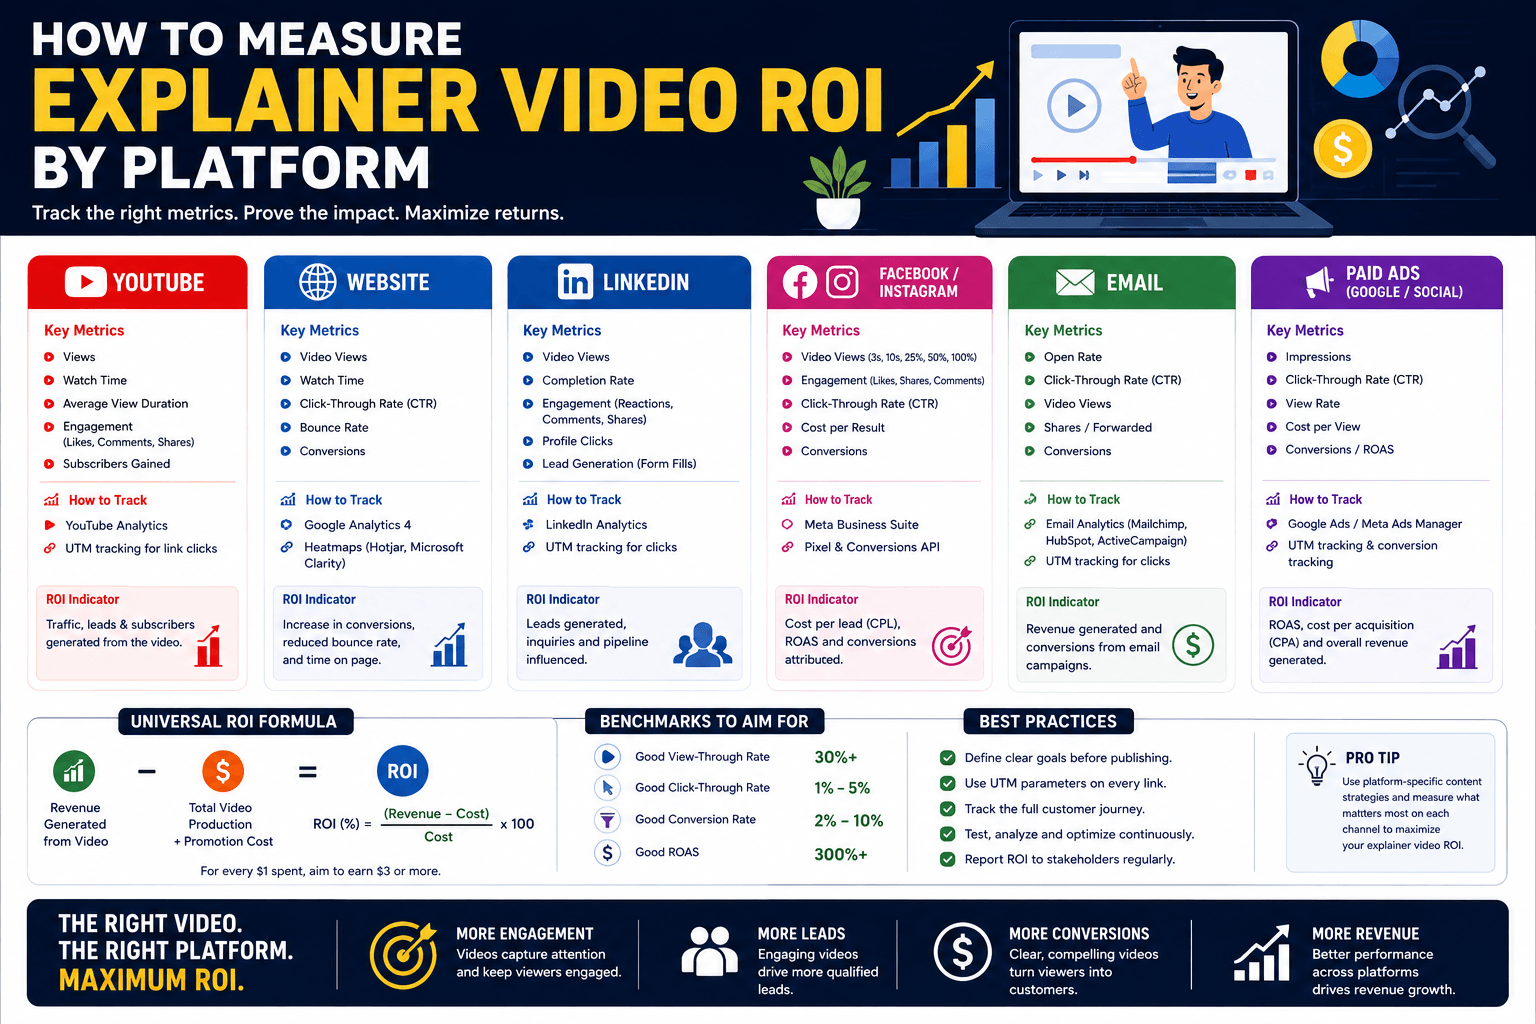
How to Measure Explainer Video ROI by Platform
One of the largest gaps in most explainer video guides is the absence of platform-specific tracking advice. The metrics and tools that matter on a website landing page are completely different from those on YouTube, LinkedIn, or inside an email campaign. Here is how to measure explainer video ROI on each major platform, along with the specific signals that matter for each one.
Website Landing Page
The highest-return placement for most businesses. Use Google Analytics 4 to create a conversion event tied to your desired action (form submit, button click, checkout). Add UTM parameters to every traffic source pointing at the page. Use Wistia or Vimeo's native analytics to see exact drop-off curves and play rate.
To isolate the video's contribution, run an A/B test comparing the page with and without the video. The difference in conversion rate is the video's direct lift.
- Play rate (plays / page sessions)
- Completion rate
- Overall page conversion rate
- CTA click-through rate
YouTube
YouTube operates as both a hosting platform and a search engine. An explainer video published to YouTube generates dual-purpose ROI: organic search traffic from people discovering it in YouTube results, and brand awareness from the suggested feed. It is the world's second-largest search engine, and ranking there for relevant queries produces compounding returns.
Use YouTube Studio's traffic source report to see how much website traffic the video is generating. In GA4, filter sessions by referral source equal to YouTube and check whether those visitors convert.
- Views and average view duration
- Click-through rate on end screen or description link
- Website referral sessions from YouTube (GA4)
- Subscriber growth from video
LinkedIn is the right placement for B2B explainer videos targeting decision-makers. Native video on LinkedIn significantly outperforms link posts in organic reach. One critical note: the majority of LinkedIn video is watched without sound, which means captions are not optional for accurate performance measurement. A video without captions on LinkedIn will underperform its actual potential and skew your ROI data downward.
LinkedIn does not provide direct conversion tracking for organic posts. Use a unique UTM link in the first comment to track website traffic from each post separately.
- Video views and view rate (views / impressions)
- Comments, shares, and reposts
- Profile visits generated from the post
- Website sessions from LinkedIn UTM link (GA4)
Email Campaigns
Actual video embeds do not play inside most email clients. The standard approach is an animated GIF thumbnail linked to the full video on your website or YouTube. Despite this technical limitation, video-linked email campaigns consistently outperform static image campaigns in click-through rates.
For clean ROI data from email, create a dedicated landing page that video viewers from email arrive at exclusively. This removes any ambiguity between email-driven traffic and organic traffic converting on the same page.
- Email open rate
- Thumbnail click-through rate
- Video plays from email traffic
- Conversion rate on the email-specific landing page
ROI Benchmarks: What Good Performance Looks Like
Without benchmarks, your metrics have no context. Here is what strong performance looks like across the key signals, based on current industry data from Wyzowl, Shootsta, SeoSherpa, and published case studies.
Conversion Rate Benchmarks
| Placement | Avg Conversion Rate (No Video) | Expected Lift with Video | Target Rate with Video |
|---|---|---|---|
| Product landing page | 2 – 5% | Up to 80% | 3.6 – 9% |
| Homepage hero section | 1 – 3% | 20 – 50% | 1.2 – 4.5% |
| Gated asset / lead magnet | 5 – 10% | 15 – 35% | 5.75 – 13.5% |
| Email thumbnail CTA (CTR) | 2 – 4% | 20 – 40% | 2.4 – 5.6% |
| YouTube end-screen link CTR | 0.5 – 2% | Varies by audience | 1 – 4% |
Sources: Unbounce; SeoSherpa Landing Page Statistics 2026.
ROI Benchmarks by Business Type
| Business Type | Year-One ROI Target | Primary Metric to Watch | Typical Payback Period |
|---|---|---|---|
| B2B SaaS | 200 – 400% | Trial signups, demo requests | 60 – 90 days |
| eCommerce | 80 – 200% | Product page conversion rate, AOV | 30 – 60 days |
| Professional services | 150 – 300% | Qualified leads, cost per lead | 60 – 120 days |
| Enterprise / high-ticket | 300 – 600%+ | Pipeline influenced, deal velocity | 90 – 180 days |
| Consumer app | 50 – 150% | Install rate, cost per install | 14 – 45 days |
Source: Shootsta B2B Video ROI Report 2026; Wyzowl 2026.
Time to ROI: When to Expect Results
This is one of the most searched questions around video investment and one of the most consistently missing topics in competitor guides. Here is the realistic timeline by placement:
- Landing page with existing traffic (500+ monthly visitors): measurable conversion data within 30 days.
- Landing page with low traffic (under 500/month): allow 90 days minimum for statistically significant data.
- YouTube organic: search-driven ROI typically takes 3 to 6 months to build. Paid TrueView promotion shows conversion data within 7 to 14 days.
- Email campaigns: click data and landing page conversions visible within 72 hours of the first send. The fastest path to initial ROI evidence for a new video.
- LinkedIn organic: meaningful engagement data within 1 to 2 weeks; meaningful traffic referral data across multiple posts over 4 to 8 weeks.
As a standard protocol for how to measure explainer video ROI across all placements, use a 90-day rolling window. This gives enough time to observe organic growth while remaining short enough to inform budget decisions for the next quarter.
The Best Tools to Track Explainer Video ROI
Knowing how to measure explainer video ROI means nothing if the tracking infrastructure is not in place before the video goes live. Missing the first 30 days of data means losing the highest-velocity period, when new placements generate their strongest conversion signals. Here are the tools that cover every layer of the measurement stack.
Google Analytics 4
The backbone of website-based ROI tracking. Create conversion events for form submits, button clicks, and checkout completions. Build custom Explore funnels showing how video viewers move toward conversion. Use UTM parameters on all inbound links to attribute traffic sources to specific video placements. Essential for every business measuring explainer video performance on their website.
Wistia
The professional standard for website-embedded video analytics. Wistia tracks play rate, heatmaps, drop-off curves at the second level, and individual viewer engagement. Its Turnstile feature captures email leads inside the video player itself. Integrates natively with HubSpot and Mailchimp for CRM-level attribution. If you are serious about granular explainer video ROI metrics, Wistia is the tool that makes that granularity possible.
HubSpot CRM
Closes the loop between video engagement and revenue attribution. Tag every lead source with the video's UTM parameters and your sales team can see, at the individual deal level, which prospects watched the video before converting. Essential for professional services businesses and SaaS companies where the sales cycle runs longer than 30 days and multi-touch attribution matters.
YouTube Studio
Provides watch time, audience retention curves (second-by-second), traffic sources, and the external links report showing which sites are embedding and linking to your video. The traffic source report is particularly valuable: it shows whether viewers found your video through YouTube search, suggested videos, or external embeds, which directly informs content and promotion strategy. Free for any YouTube-hosted video.
Hotjar
Heatmaps and session recordings showing how visitors interact with the page around your embedded video. Useful for understanding whether the video is actually being seen (scroll depth), whether the CTA positioned near the video is getting attention, and whether mobile visitors are interacting differently from desktop users. Particularly valuable during the first 30 days after launch when you are optimising placement.
Platform-Native Analytics
LinkedIn Video Analytics, Facebook/Meta Video Insights, and Vimeo Analytics each provide native performance data for their respective platforms. For multi-platform distribution, use a UTM tracking matrix to attribute website traffic from each platform back to GA4. This gives you a single source of truth for cross-platform explainer video performance without paying for a third-party aggregation tool.
Why Your Explainer Video Is Not Delivering ROI (and How to Fix It)
When results come back lower than expected, the problem is almost always diagnosable within the first 30 days if you have the right tracking in place. Here are the five most common causes of underperforming explainer video ROI and the specific fix for each.
Low play rate (under 30% of page visitors press play)
Cause: The video is placed below the fold, autoplay is off with no visible play button, or the thumbnail image is weak and does not communicate the video's value. Many visitors do not realise there is a video on the page at all.
Move the video above the fold. Set it to autoplay muted with captions active (muted autoplay is permitted by all major browsers; sound-on autoplay is blocked). Test three different custom thumbnail images. A thumbnail showing a human face or a clearly framed visual problem consistently outperforms abstract graphics or default frame grabs.
High drop-off in the first 15 seconds
Cause: The video opens with a logo animation, a brand name reveal, or a generic statement about the problem space. Modern viewers, particularly those arriving from paid traffic, will not wait for the core message. The first 15 seconds must deliver the hook before anything else.
If the video is already produced, re-edit the opening. Start at the tension point: the specific problem the viewer has right now. Remove any branded intro sequence. If the video cannot be re-edited, add a text overlay card as an animated pre-roll addressing the viewer directly within the first 5 seconds.
Strong completion rate but low CTA clicks
Cause: Viewers are watching and understanding the video but not taking action. The CTA inside the video or placed immediately below it is too generic, not specific enough, or not relevant to the viewer's next logical step.
The CTA must be a direct continuation of the video's promise. If the video explains a problem, the CTA should promise a solution. If the video shows a product in action, the CTA should offer a demo, a trial, or a specific quote, not a vague "learn more." Test two CTA variations with different action verbs and measure the click-through rate difference over 14 days.
Good CTA click rate but low post-click conversion
Cause: The page viewers land on after clicking is misaligned with the video's message, tone, or visual register. The viewer built trust through the video and then arrived at a generic page that broke the continuity of the experience.
Create a dedicated post-video landing page that mirrors the language and core value proposition from the video. Use the same visual style where possible. This landing page should be exclusively accessible through the video's CTA, which keeps attribution clean and conversion rates measurable. Page continuity between the video and the destination is one of the highest-leverage conversion improvements available with no production cost.
Tracking gaps: zero revenue attributed to the video
Cause: UTM parameters were not configured before launch. The CRM lead source field is not populated. Conversion events in GA4 were not set up. The video is live but there is no infrastructure to connect it to business outcomes.
Retroactively add UTM parameters to all links associated with the video (social posts, email campaigns, paid ads). Set up GA4 conversion events for every desired action on the hosting page. Install the relevant CRM integration. Future periods will be fully trackable even if historical data cannot be recovered. Going forward, make tracking setup a launch prerequisite, not an afterthought.
How Explainer Video ROI Compares to Other Marketing Channels
Understanding where explainer video sits relative to other channels helps build the internal case for video investment and set realistic expectations for stakeholders who are comparing options.
| Channel | Typical Year-One ROI | Speed to Results | Permanence | Best For |
|---|---|---|---|---|
| Explainer video (well-placed) | 200 – 500% | 30 – 90 days | High (works indefinitely) | Conversion lift, trust, clarity |
| Paid search (Google Ads) | 50 – 200% | Immediate | None (stops when budget stops) | Intent traffic, direct response |
| Content marketing / blog SEO | 100 – 350% | 6 – 18 months | High (compounds over time) | Long-term organic traffic |
| Email marketing | High (low cost base) | Immediate | Medium (list-dependent) | Existing audience nurture |
| Social media organic | 0 – 100% | 3 – 12 months | Low (algorithm-dependent) | Brand awareness, community |
The key advantage of explainer video in this comparison is the combination of speed and permanence. Unlike paid search, a video does not stop generating results the moment the budget runs out. Unlike blog content, video communicates trust and product clarity in under 90 seconds, which compresses the decision timeline for new prospects.
Explainer video performs best when paired with a channel that drives traffic to the page where the video lives. Paid search brings high-intent visitors; the video converts them. That combination consistently outperforms either channel in isolation. For businesses looking at their first explainer video company engagement, this paired approach produces the fastest and most measurable return.
According to Wyzowl's 2026 Video Marketing Statistics, 85% of people have been convinced to make a purchase after watching a brand's video, and 83% of video marketers report that video directly increased sales. The channel works. The question is always whether the measurement infrastructure is in place to prove it internally.
Frequently Asked Questions
To measure explainer video ROI, apply the formula: ROI = ((Revenue Attributed to Video − Total Video Cost) / Total Video Cost) × 100. Identify revenue through UTM tracking, CRM lead source data, or a dedicated post-video landing page. Track four metric categories simultaneously: engagement, conversion, revenue, and support deflection. Use a 90-day minimum measurement window for reliable results and include all cost components (production, promotion, internal time) in the denominator.
A strong first-year ROI for an explainer video starts at 200% for most business models. B2B video programs report 250 to 500% ROI in year one according to Shootsta's 2026 data. For landing page conversion rate specifically, a lift of 20 to 80% over a text-only baseline is the expected range when the video is professionally produced and placed above the fold. The right benchmark depends on your industry, average sale value, and the traffic volume reaching the page where the video is embedded.
Most businesses see measurable results within 60 to 90 days of publication. A landing page receiving 500 or more monthly visitors will produce statistically meaningful conversion data within 30 days. YouTube organic placements take 3 to 6 months to generate search-driven traffic. Email-embedded video placements show click data within hours of the first send, making email the fastest path to initial ROI evidence for a newly produced video.
To know how to measure explainer video ROI accurately, track five core metric categories: completion rate (engagement quality signal), CTA click-through rate (intent signal), conversion rate on the hosting page (action signal), cost per lead (efficiency signal), and revenue attributed to the video (business outcome). For platform-specific measurement, add play rate for website embeds, average view duration for YouTube, view rate for LinkedIn posts, and thumbnail click-through rate for email campaigns.
Yes, consistently. According to data from Unbounce, a well-placed explainer video increases landing page conversion rates by up to 80% compared to text-only equivalents. The average landing page conversion rate across all industries is approximately 6.6% without video. The lift is consistent across sectors when the video is positioned above the fold, set to autoplay muted with captions active, and directly aligned with the page's core value proposition.
The minimum viable toolkit is: Google Analytics 4 for website conversion tracking (free), a video host with analytics such as Wistia for website embeds or YouTube Studio for YouTube-hosted content (free), and a CRM such as HubSpot for lead-level revenue attribution. Adding Hotjar for heatmap and session recording data gives you the full picture of how visitors interact with the page around the video. Most of the infrastructure needed to measure explainer video ROI comprehensively is either free or already included in tools your business uses.
Start Measuring Before You Publish
The single most common mistake when learning how to measure explainer video ROI is treating tracking as a post-launch task. By the time teams set up UTM parameters and conversion events after a video goes live, they have already lost the first two to four weeks of data, which are often the highest-traffic period for any new asset.
The framework above covers everything required to know about how to measure explainer video ROI accurately: the formulas, the four metric categories, the platform-specific tracking methods, the industry benchmarks, and the diagnostic process when results fall below expectations. Put the infrastructure in place before the video launches, define your measurement window (90 days minimum), and compare results against the benchmarks in the tables above.
According to Wyzowl's 2026 survey, 82% of marketers report that video delivers strong ROI, and 91% of businesses now use video as a marketing tool. The businesses that cannot measure that ROI are the ones still relying on view count as their primary success metric. The businesses that can measure it are the ones investing in more video, because the data tells them to.
If you are planning a professional explainer video for your business and want to understand what realistic ROI looks like for your specific industry and audience size before you commission, our team at Magic Motion Studio can walk you through comparable project data before production begins.
Get an Explainer Video That Performs
Professional animation, measurable results. We produce custom 2D animation and explainer videos for brands across Australia and the US.
Get a Quote →Related Guides
Further reading for teams learning how to measure explainer video ROI and build a trackable video production workflow:
- What Is an Explainer Video? Types, Styles and Examples
- What Is 2D Animation? Complete Guide for Businesses
- What Are Motion Graphics? Guide for Businesses
- Explainer Video Storyboard: How It Works and What to Expect
- Explainer Video Examples That Convert: 12 Real-World Results
- How to Use Explainer Videos in a Sales Funnel
- Best Explainer Video Companies in Australia
- Explainer Video Cost in the USA: 2026 Pricing Guide